Still experiment design should be changed a bit. Now i use z-scores of 1 minute cycle to calculate brightness, so graph of the whole day may not show the significant deviation if the deviation inside 1 minute cycles changed its direction. Brightness will be high regardless of the direction is z-score is high. I will need to calculate brightness by total z-score next time.
Yes, z-score = (1s-0s) / Sqrt(total bits) = (2 x 1s - total bits) / sqrt(total bits). Two ways to write the same equation.
So I take it the accumulated deviations = (1s-0s). That makes the upper trace (yellow) max deviation about z = 1.9, p = 0.029. But, allowing both positive and negative deviations makes this a two-tailed test so the probability must be doubled: p = 0.057, just on the threshold of significance. I estimated the deviation by eye, so p could be 0.05.
Even though this is “first light” as they say in astronomy (though literally in this experiment), it’s really hard to go from conception to actual experimental results – great work.
Since in the first experiment brightness was caculated from absolute value of 1 minute z-scores, to summarize the results of the day i used Average of the absolute values of z-scores as the measure of leptocurtosis among 1 minute cycles. The values themselves are less interesting than their comparison.

Most of the Days had in average bigger deviation amplitude than Empty tank.

you should run that experiment longer.
Aglae is alive and can into evolution. So, after a while, you’ll get more potent strain, probably.
For evolution more complicated setup is required, something like test-tubes array with separate led-diodes, controled by separate entropy streams. And every day all test-tubes should be re-filled with sample from the one of biggest z-score.
That’ll make things a lot faster. but that setup will still work.
btw, that setup needs thermal sensor. temperature differences might explain, why it works differently from day to day.
Updated experiment design so the brightness is now calculated from z-score of total accumulated deviation for day instead of 1 minute cycles. I was worrying that the brightness will change to slow to make an observable feedback for algae and first 2 days no anomalies were observed, but the rest of the week looks much more interesting.

Here is an average brightness value for each day of the experiment.
uhhh…possibly, we need to try to make this thing to solve sort of optimisation task. for example, to use random output as entropy for genetic algorithm. and hook up mean fitness to brightness of LED.
I’ll try to reproduce your experiment.

Conducted a six-day experiment, where the brightness of the lamps was determined by the absolute value of the Z-score accumulated per hour. The cycle was repeated for 10 hours every day. The cumulative deviation curves do not look particularly interesting, since the positive brightness of the lamps is produced by a deviation of any direction, which means that the deviation that occurs at different hours can have a different direction. Initially, I wanted the lamps to light up only with a positive deviation, but on small deviation accumulation cycles (2 min), the effect was not observed at all and I had to increase the accumulation cycle to an hour, and I could not risk that the lamps would not shine for several hours, since that would break the feedback.

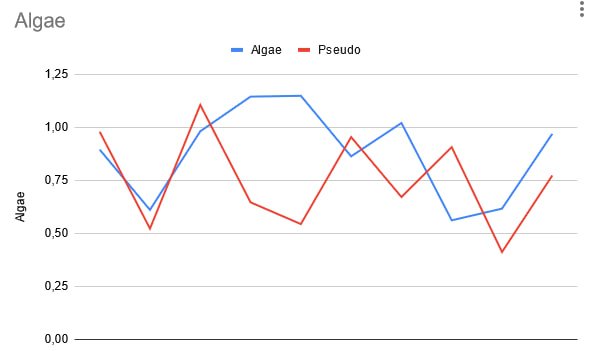
However, to evaluate the effect, I used the arithmetic mean of the absolute z-score values, which acts as an indicator of the amplitude of the graph fluctuations. Compared to the Parallel control measurements on Pseudo, this figure was:
Algae: 0.88
Pseudo: 0.75
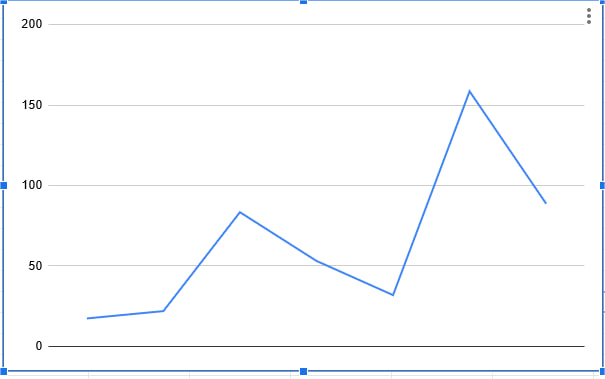
It looks even more revealing if you take not all, but only the final Z-score values for each hour, and then average their values for the day. We got the following series:
Algae Pseudo
0,22 0,66
1,01 0,56
1,34 0,65
0,9 0,74
1,29 2,05
0,82 0,59
Using quartiles, we will exclude the values 0.22 and 2.05 as statistical outliers. Then the arithmetic mean will be:
Algae: 1.07
Pseudo: 0.64
Also interesting is the graph of the average z-score values for all days by the hour. It shows that the largest signal from Algae was observed in the period 12:00 - 14:00, which approximately coincides with the time of maximum illumination in the natural environment.
Try to test it with smaller/greater amount of aglae. Interesting, how does effect scale with different amount of vegetation.
I recently discovered an interesting phenomenon, which I still cannot find a mathematical explanation for.
I’ve been experimenting with the ability of algae to use the Fatum Algorithm to find a target on a 2D plane. For this, a high-resolution attractor survey method was developed:
Within an hour, one point is generated every second, which is added to the plane. Attractor (the zone of the highest density of points) - is recalculated on the basis of all accumulated points also every second. The brightness of the lamps above the setup is inversely proportional to the distance between the attractor and the target. The target is set pseudo-randomly at the beginning of each hourly cycle.
Thus, the attractor is formed within an hour with a constant feedback.
At first, I only compared totals, such as the distance of the attractor to the target at the end of the hour, or the arithmetic average of all the distances of the attractor to the target during the hour. These indicators did not show significant deviations relative to a similar measurement on a pseudo-RNG.
However, their dynamics seemed quite interesting to me.
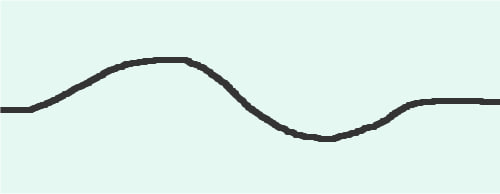
When averaging all the experiments per day, the graphs of distance between attractor and the target relative to the amount of accumulated dots from three days showed a similar pattern. If we average all 36 hourly experiments, the graph is as follows: At the beginning of the graph, the attractor is moving away from the target, and in the second half, the attractor is approaching it. The entire greyik resembles a single sine wave.
I compared it with the graph of pseudo-random experiments and in principle there the curve also goes down, but without a significant rise at the beginning.

It becomes most interesting if you increase the density of measurements, taking not 1 point per second, but 4. Then the final attractor per hour will be based on about 10,000 points. And then everything becomes strange: Two days of 12 experiments each were filmed. The graphs for each day are extremely similar and look like a single wave of a sinusoid, but already inverted - at first a strong approach to the target somewhere up to 3000-4000 points, and then a sharp distance with a subsequent return to the average.

Interestingly, if the pattern were a mathematical bias, then, in theory, it should not have behaved differently on the interval 0-3000. It is also interesting that the pseudo-random analogue of the experiment, taken on the first day, did not show the same sine at all.
Another important feature is that the sine is observed only in the case of points obtained by the binary word method. If you get points through random walks, the wave is not observed. I don’t know yet what conclusions to draw.

@ScottWilber what do you think about it? In fact, it looks like when using the binary word method, the distance between the attractor and the target changes as points are added to the field in such a way that it makes up a pattern of a single oscillation of a sinusoid. It is characteristic that the wave is stretched over the entire series, regardless of what length of the series of added points is chosen, and in a series of 3000 points and in a series of 10000 points, there will always be only one wave, but when stretched, it may turn upside down. This may indicate that any measurement extended in time contains a rubber band effect equal in strength to the signal.
At first glance I would guess this is an artifact of how you are processing the data (using binary word method), especially since the pattern doesn’t show up with random walk or pseudorandom processing. Alternatively, it could be a fluke that will disappear if you run enough series. Either way, I doubt it’s a response to a real effect.
I suggest trying to do a simulation (using the same processing) that duplicates the pattern outside the experiment. That would confirm it’s an artifact.
Pseudo-random one uses the same algorithm, the only difference is that Pseudo is a source of randomness instead of PQ128MS and the result is not sent to the lamps. I usually run Pseudo in parallel to every exeperiment as a control one.
Random walk is different in a sense of how each singular dot is generated, but binary word dots are just as random as RW ones, i don’t think it could be any statictical bias related to it. I could believe, that the attractor search method may be biased, but it looks strange, that this pattern doesn’t show up on pseudo then. And the way, how the wave is scaling to the series length is also against the assumption, that it is related to the dots amount directly.
Also on the second picture i compared two graphs made on different days. Each one is an average of 12 series. They look pretty similar.

This is very interesting, I honestly haven’t though about that, I’m really curious to see the results. Maybe down the line you could identify which plants have stronger genes to PSI, or to which kind of PSI