Happy New Year!
I’ve put the pacman/bias amplification/MV work on hold for a little bit while over the past few days I’ve been focusing on MeterFeeder library and the Parking Warden graph tool.
I updated MeterFeeder to allow the consumer to specify how many bytes per call.
And I used this to modify Parking Warden which should now hopefully automatically detect any devices you have plugged in and graph them accordingly. It’s also now multi-threaded so the MED-reading/bitwise operations are one one thread and the graphing on another (with a shared FIFO queue).
Graphing in Python is new to me so there’s probably some much better/faster ways of implementing but I haven’t got around to reading up on the use of matplotlib in great detail.
Anyway, here’s a 64-bit Windows build:
https://github.com/vfp2/MeterFeeder/raw/master/ParkingWarden_20200105.zip
Unzip it and run parking_warden.exe. Hopefully this will work with multiple devices. Unfortunately the v1 I have has stopped working (no green light, not detectable and infact actually disables my USB ports altogether on Mac with OS X saying too much power is being consumed - and even my last remaining working device, a v3, doesn’t work when the broken v1 is plugged in).
I can’t tell anything about the non-functioning device. They are usually pretty robust, but these devices are about 10 years old and have not been handled carefully. You may try connecting through a powered USB hub as some USB ports – especially on laptops – don’t supply near the current expected from the USB specifications.
When I try to run parking_warden on Win7 I get an error message:
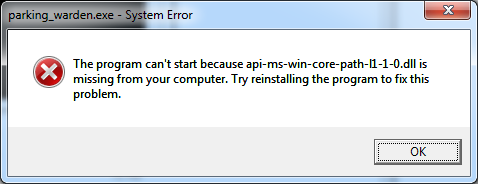
I didn’t find this dll on my computer.
I found some instructions at
https://wikidll.com/microsoft/api-ms-win-core-path-l1-1-0-dll
and applied Method 3 (command prompt manual scan and repair) to fix it. Microsoft pretended to fix all defective files, but I got the same error message after rebooting and trying again. When the instructions don’t work, things get a little harder for a non-programmer.
I thought there might be some issues like this. Windows is notorious for making something simple difficult. My main Windows 10 machine stopped booting the other day (not a good end of year with 2 devices breaking  ) and I only have a secondary very-slow Windows 10 laptop at the moment. I’ll look into this DLL specifically and how it relates to the program.
Are you running on a 64 bit machine?
It is a 64-bit machine running Win7. I will probably see if there is another way to install/repair the dll, if that is even what the issue really is. I don’t much trust windows error messages to be accurate.
It turns out the version of Python I built it with (3.9) isn’t supported by Windows 7 so I tried rebuilding it with Python 3.7. Please try this:
https://github.com/vfp2/MeterFeeder/raw/46074aba135d3a7d410400351a84e8d5ddcb4f49/ParkingWarden_20200105b.zip
I think it got further, but gives this error:
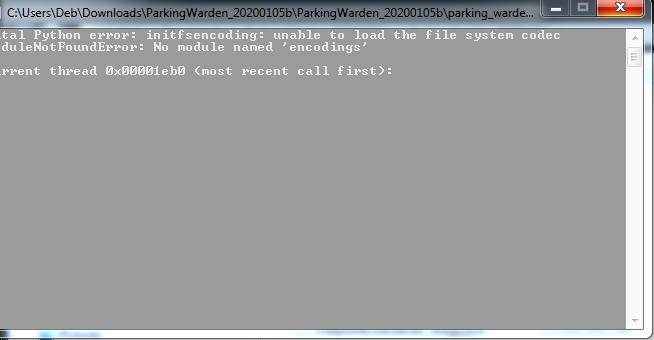
There is a folder named, encodings.
How about this one?
I tried building it with Python 3.8.7.
If the error persists I have will have to track down the particular module that seems to be missing from the package and is causing this error.
https://github.com/vfp2/MeterFeeder/blob/f27879a68da77c467ed086a5a62aeffcaafaa6b2/ParkingWarden_20200106a.zip
The process seems to be running (the Task Manager says it’s running), but I don’t see anything on the screen. One other possible issue I note is my Advanced System Care Ultimate firewall asks for permission for the application to access the compressed file, library.zip. I allow permission, but there is no noticeable change. I also tried unzipping the library file in the Parking Warden folder – no change.
I do have an MMI generator attached. Should that be connected or disconnected, or will multiple devices make a difference? I guess most importantly, what should I expect to happen or see?
Once it’s running you should see a black console window with timer logs plus another window which is the actual graph. The graph should show any USB devices plugged in (I have only 1 working now but David said it was working for him with 2).
The security/firewall software might be blocking something. Is there anyway to temporarily disable it while you try?
The current configuration has a thread continually reading 256 byte blocks of entropy from the device(s) and putting the results of the bitwise/random walk operations into their own thread-safe queues. The graph runs on a separate thread and pulls from all the queues.
In the console window, tone line is the ms time to read one 256 block from a device. The right side column is the ms time between draw frames on the graph.
I’m aware there’s probably a lot more fine tuning to do with this.
I was able to get the program to work. When I allowed the program to access the library.zip folder (flagged by the firewall), I previously did not check the remember box. When I did that the program and the graphics started working. I assume this can be patched by not having to access a zipped folder within the main folder.
More info on the operation and display:
I expect the time to take 256 8-bit words to be about 20ms, while the display shows 00.00010 to 00.00020 (the value builds up over several seconds and then flips back to the lower number). The second column shows about 00.000050 to 00.00010, building up in the same cycle as the first column. This time variation is real, because I can see the slowing of the plot until it “rolls over” and speeds up suddenly. For a test I attached three devices and it reads all three and identifies them correctly as to type. I’m not sure what the numbers in brackets following the MMI generator identification are, but they generally start out negative (about -200) and build up to about -1000 to -6000, and then mostly stop changing.
I suggest using enough bits to produce about 5 outputs per second (200ms trials). That’s about 2048 bytes (using an even power of 2) giving an average output rate of 6 per second. Or, a more exact number of bytes for 5 trials per second would be closer to 2500 bytes, assuming a nominal 100KHz and no loss due to computational overhead. The cycling noted above takes about 10 seconds to repeat. I expect this is a symptom of an underlying processing or data transfer issue.
Note, processing will be different for continuous and initiated trials.
Am looking into these.
You reminded me I needed to also implement a user-initiated trial function because at the moment it’s just continuous.
New version available here: https://github.com/vfp2/MeterFeeder/raw/master/ParkingWarden_20210204.zip
I’ve tidied the timing so it prints clearer in just milliseconds and each column has a header now.
I removed the capacity limit on the FIFO queue shared between the MED-reading threads (one per connected device) and set the number of bytes for each call to 1024 bytes. On my MacBook I get output similar to the following. This is approximately 1 second’s output, averaging 6-7 trials per second. If I set the call byte size from 1024 to 2048 then we start finding we get 3-4 trials per second and each trial takes in the high 200+ms range. This is only on my computer, and thus specs of the machine will influence the timings.
Note also Python is known as not being a high performance language so we can assume there is some time taken in the data transfer and computing due to that. Going on your benchmark of 256 bytes @ ~20ms, I was getting 2-4 times that.
READ TIME		DRAW TIME
    127ms
    			40ms
    122ms
    134ms
    			73ms
    183ms
    			65ms
    155ms
    			74ms
    148ms
    			74ms
    154ms
    			78ms
Please let me know how the timings run on your machine and if we should tweak it anymore.
If we want to have more precise control over the actual timing we could implement something based on a timer.
Then I can go ahead and start the modification to enable user-initiated trials.
Ah, and I forgot to explain the numbers beside the device name:
[a, b, c]
a - the lowest Y-axis value reached during the random walk
b - the highest Y-axis value reached during the random walk
c - the current Y-axis value in the random walk
I added these because I found having the graph dynamically resizing itself to scale automatically was a bit distracting. Currently the walk isn’t bounded. The Y-axis is fixed at +/- 2000. Sometimes when the walk went well of the charts I found it helpful to have a numerical output of where things currently were off-screen. This of course can all be changed.
I’ve added support for switching between continuous and user-initiated trial modes.
https://github.com/vfp2/MeterFeeder/raw/master/ParkingWarden_20210207.zip
It will start in continuous mode, and you can press the “Continuous Mode/Reset” to either toggle back to this mode, or reset the graph if already in the mode. The buffer read for each of these trials is still set at 1024 as mentioned in my previous post above.
You can press the space bar or click the “User-initiated Mode/Grab” button to toggle from to this mode. Subsequent button/space presses will initiate a single trial. For the mean time I’ve set this buffer read to 2048 bytes. When in this mode, you can also press R to reset.
Rough demo video complete with whining kids in the background 
A couple of notes so far:
I still have to tell the firewall to remember to allow the program to run - not a big issue now I know.
When I am running two generators and disconnect one, the program still thinks there are two attached. The plot for the one disconnected continues the curve by adding the previous data block to the current plot, which must still be in memory. If the plot is moving down, it continues down form the last point and the same pattern during the trial is repeated. The program must be restarted if the number of generators is changed.
I see you are plotting a significant number of points for each initiated trial. In most real applications – though not all – only one result per initiation/trial will be produced.
The numbers on the right side of the data output increase as the plot moves from left to right. For the continuous mode, the range is about 35-140ms. The numbers on the left side increase between about 112-140ms as the plot increases from the left edge to the right edge. For the initiated trials, the numbers on the right increase from about 28-110ms. The numbers on the left increase from about 250-280ms. All measurements made with two generators attached. There is considerable variability in these numbers.
I notice the plots get out of sync with each other (some run faster than others). This is more obvious when I use three generators, and it gets progressively more extreme (accumulates) as time goes on.
I think I know the reason why your firewall isn’t remembering your setting - because each version of the program I’ve been giving you has had the release date in it, so each time from the firewall/security software’s point of view it’s in a different location and not remembering your previous setting (as it’s path-based most likely). I’ll try and make it so going forward the zip filename has the date in it but that the folder that is unzipped is the same, thus you can maintain the same path each time and just overwrite the old files.
I only have one working device at the moment but I know why the graph behaves the way it does if you disconnect a device while the app is running. I think I can rectify that easily. How important is it to have the ability to have the running program recognize a device after you plug it in? We can either just go with the rule that you need to have at least all devices plugged in to begin with (before you open the app) or I can add a special monitor thread that looks for newly-connected devices. Detecting a device’s disconnect should be a simple matter of looking for errors-on-read and preventing the graph from the repeating pattern.
I’m plotting each y-axis up/down change in the counter for the the random walk. So for either continuous mode @ 1024 bytes/read or user-initiated mode @ 2048 bytes/read it’s 8x that value. These of course can all be adjusted. Going on the “one result per initiation/result”, should we treat that like a single +/- increment/decrement on the graph with a simple majority-vote type approach for each trial(result)?
I’ve attached my console’s output. Could you post me through yours as well? I’m trying to figure out what might be causing this gradual increase in time per “slide”.
The issue with plots getting out of sync is something I won’t be able to test until I have some new devices (which Jamal has sent me and should be arriving in a few days)
No problem making it a rule all devices under test must be connected before running the program. I note some strange behavior with the graphics. With one device connected, the data does not always plot or it just plots an initial block as if it were initiated, even though it is running continuously (when this happens, the buttons are not responsive – nothing has an effect except closing the program):
Also, with one device connected, the two columns don’t show up on the screen. If I open a second instance of the program, the second column appears in a separate window (plot with two screens side by side below). The increase in timing is not obvious with only one device connected in this set of data, but there seems to be some variation with each different time I run the program.
.
With two devices connected, two columns appear every time:
I know it’s very hard to debug on different machines and from a distance without real-time feedback of issues.
Since the timing change seems to be correlated with the plotting, I suspect it may have to do with how the data is stored for the plot, or how it is actually plotted.
The reason the plots from multiple devices diverge is likely because the number of bits needed to produce an output bit using bias amplification varies statistically. We can calculate the average number of bits per output, but not the exact number for any single sequence of bits. Given this statistical variations in output timing and using a constant number of input bits, some variation between different generator processing is expected.
This bring up another of your questions: when combining a number of bias-amplified output bits, the appropriate way to combine them into a single bit for display is by majority voting them. Care must always be taken to ensure the number of bits majority voted is odd so there is no possibility of a tie, which would be an indeterminate outcome.
Modeling and testing have shown when bias amplification is followed by majority voting, there is a loss in efficiency. However, the variability in timing between bias amplification output bits sometimes makes it desirable to go directly to majority voting. In the case of the MindEnabled Devices (MED), bias amplification is already performed inside the generator chip. When a fixed number of bits/words is requested, the variation in timing is ignored and the number of bits delivered is constant. There is just a slight variation in timing of delivery of the output. However, the generation rate – 100 Kbps – is rather fast so the variation in timing is small enough to be insignificant for most applications.
What I suggest is that the output from the MED be directly majority voted to produce the final 1 bit per trial or the multiple outputs per block of data taken for continuous mode. Since the number of bits requested will be equal for each generator to be compared, the number of final output bits will also be equal. In continuous mode, the outputs from multiple generators plotted will stay equal. In addition, it’s easier to do the processing and housekeeping. A lookup table can be used to process each word (described previously) so there is little processing overhead. An adjustment must be made for the final word in each majority vote to ensure an odd number of bits are used. Either mask the MSB to 0 and use the regular lookup table, or process bit-by-bit.
There is little additional loss of overall efficiency when majority voting is applied to more of the bits prior to the final output versus bias amplifying more bits prior to majority voting for the final output.

 ) and I only have a secondary very-slow Windows 10 laptop at the moment. I’ll look into this DLL specifically and how it relates to the program.


